A platform dedicated to providing unbiased reviews of newly launched applications, analyzing everything from their features to their full potential.
info@scoutforge.netProduct
© 2025 Scoutforge. All rights reserved.
A platform dedicated to providing unbiased reviews of newly launched applications, analyzing everything from their features to their full potential.
info@scoutforge.net© 2025 Scoutforge. All rights reserved.
A platform dedicated to providing unbiased reviews of newly launched applications, analyzing everything from their features to their full potential.
info@scoutforge.net© 2025 Scoutforge. All rights reserved.
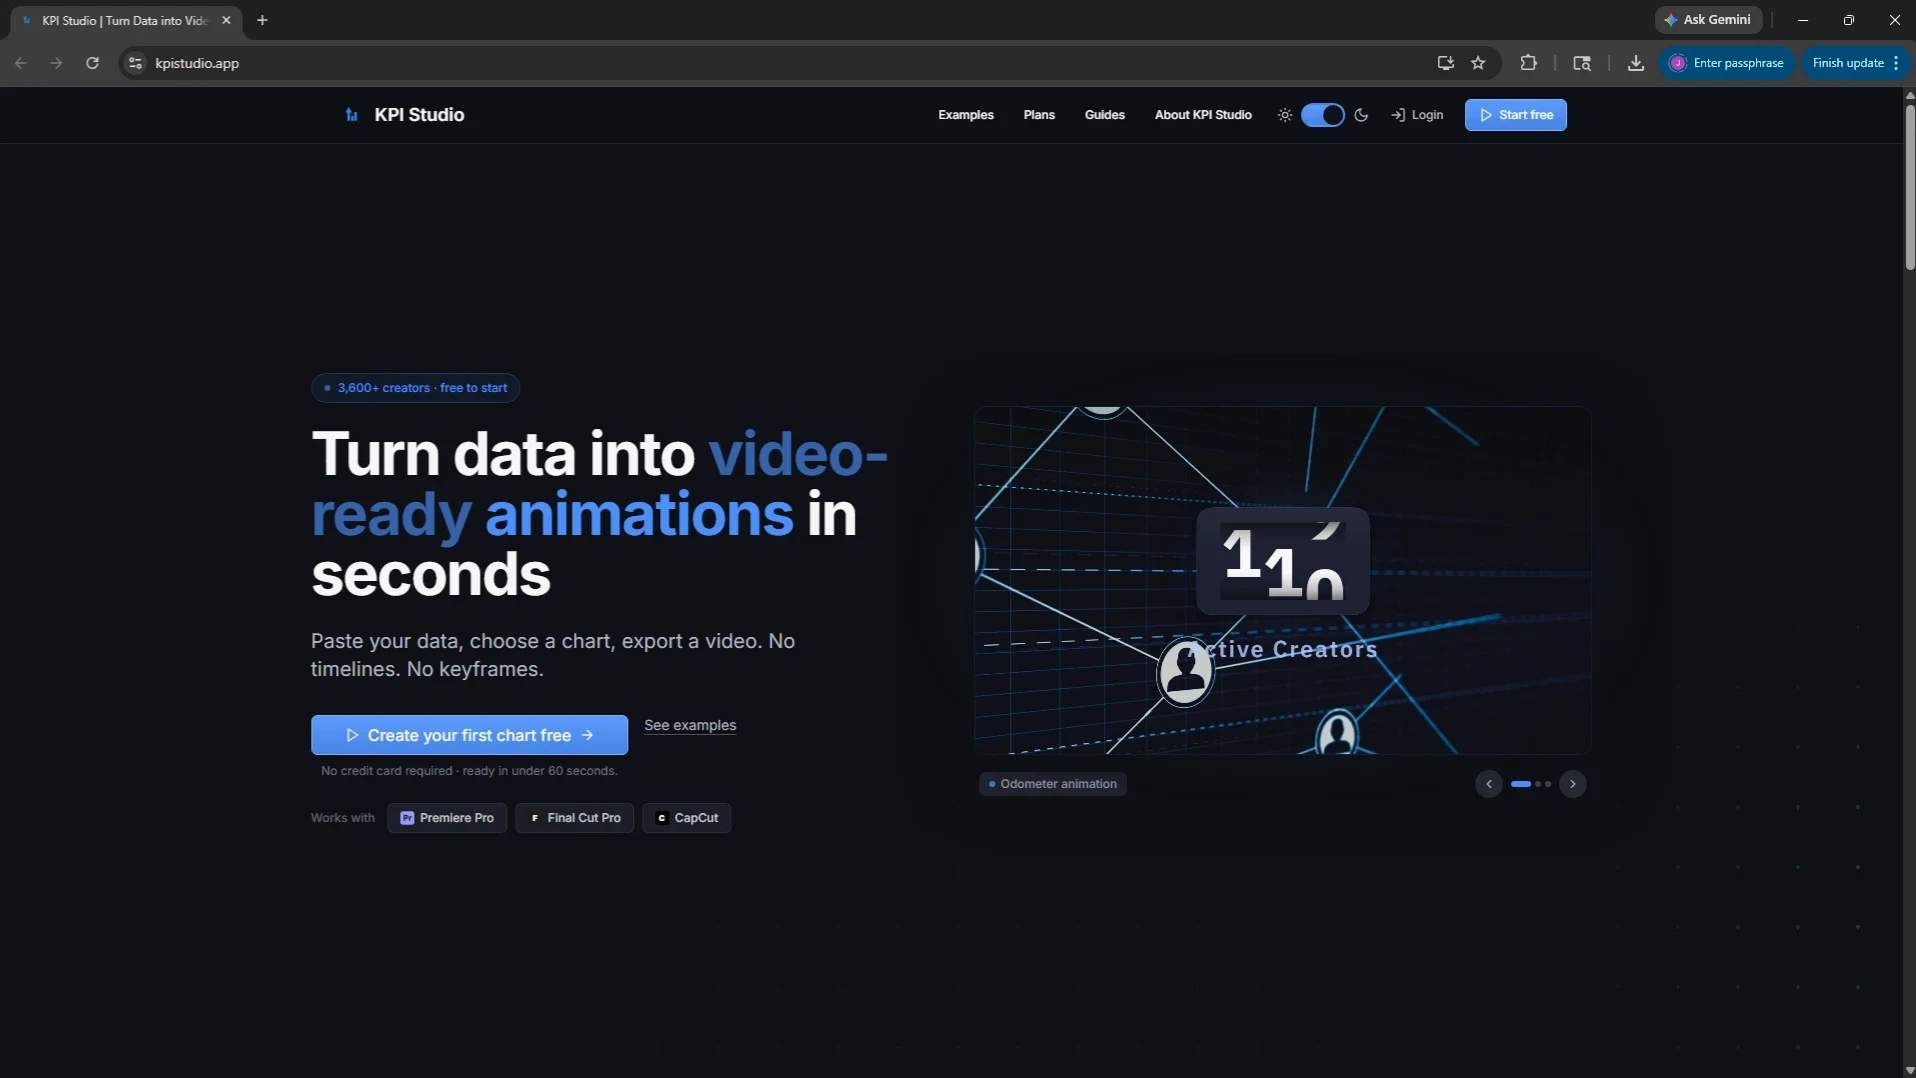
KPI Studio is a game-changer for content creators, marketers, and data analysts who need to present data visually in videos. Instead of spending hours in After Effects or manually animating charts, you simply paste your data, choose a chart type, and export a video-ready animation that works seamlessly with Premiere Pro, Final Cut, and CapCut. No timelines, no keyframes—just clean, professional data visualizations ready for your next explainer, report, or social clip. I’ve been using it for my YouTube channel, and it’s cut my production time by half. The best part? It’s web-based, so there’s no software to install. If you regularly feature KPIs, statistics, or any chart in your videos, this tool is a no-brainer. Highly recommended for anyone looking to streamline their data storytelling workflow.
Scout Review
0Feedbacks

A data visualization platform that allows creating interactive charts and maps, but requires more manual setup for video export.

Focused on static and interactive charts for web publishing, less suited for video animation workflows.

A general animation tool that can create chart animations but has a steeper learning curve and slower output.
KPI Studio is a focused, high-usability tool that delivers on its 'paste data, get video animation' pitch. With strong design, excellent speed for its workflow, and perfect targeting at video content creators, it earns a solid 78. It shines brightest for anyone making explainer videos, reports, or social clips with KPIs and stats. Limitations around security transparency, accessibility, and free tier caps prevent it from reaching elite status, but for its intended audience it's genuinely transformative and cuts production time significantly.
| Features | ||||
|---|---|---|---|---|
| Video-Ready Animation Export (MP4/GIF for NLEs) | Strong: Native MP4 (H.264) & GIF export, direct Premiere/Final Cut/CapCut support | Weak: Primarily interactive web embeds; no native video/MP4 export for editors | Poor: Focused on static/interactive web charts; minimal animation, no video export | Good: Supports chart animations and video output but requires more manual setup |
| Ease of Creating Chart Animations | Excellent: Paste data → choose template → customize → export in seconds, no keyframes | Good: Template-driven but more setup for storytelling; not video-optimized | Good for static: Very easy for web charts but limited animation/video features | Moderate: General animation tool with steeper learning curve for charts |
| Number of Specialized Animation Types | 10 dedicated templates (count-up, bar race, odometer, gauge, map path, pictogram, etc.) | Many interactive charts/maps with transitions, but fewer video-specific animations | Wide range of static charts; limited built-in animations | Broad animation tools but requires manual construction of charts |
| Target Workflow Fit (Video Content Creation) | Excellent: Built specifically for video editors & creators needing quick KPI animations | Moderate: Strong for web storytelling & interactive embeds, weak for video export | Moderate: Best for web publishing & journalism, not video production | Good: General-purpose animation but slower and less specialized for data |
A platform dedicated to providing unbiased reviews of newly launched applications, analyzing everything from their features to their full potential.
info@scoutforge.net© 2025 Scoutforge. All rights reserved.
