Cycling through all six. Tap any point to stop.
Measured on six things
Create editable scientific figures and graphical abstracts from research descriptions with AI.
Growth
58Real problem (researchers waste hours in Illustrator), specific audience (academics), and a concrete wedge: one-time credit packs instead of subscriptions. Differentiated but not defensible against generic AI image tools.
Screenshots
1 / 1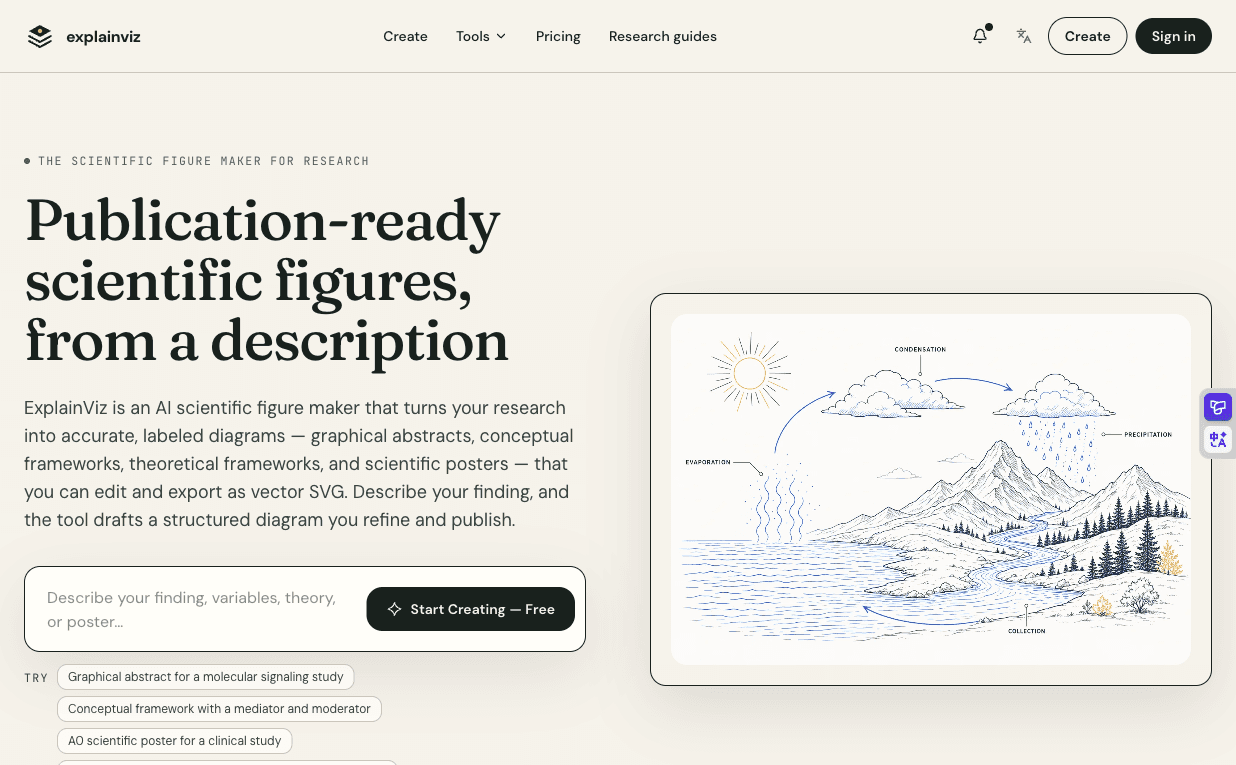
About this app
ExplainViz is an AI scientific figure maker for researchers, students and academic teams. Turn research descriptions into graphical abstracts, conceptual or theoretical frameworks, scientific illustrations and posters. Review labels and relationships, refine the figure and export editable SVG or high-resolution images for papers, theses and presentations. Free starting access and one-time credit packs are offered on the website, with packs starting at $5 for 12 credits.
Key features
- 1AI-generated scientific figures from text descriptions, including graphical abstracts, conceptual frameworks, theoretical frameworks, and posters.
- 2Editable SVG export and high-resolution output sized for journal specs (Elsevier, Wiley, Cell Press).
- 3One-time credit packs starting at $5 with no subscription, credits never expire, and all features unlocked on every pack.
Target customer profile
Drawn from the product itself, not from a survey.
Demographic
Researchers, students and academic teams
Pain points
Preparing graphical abstracts, research frameworks and labeled scientific illustrations
Primary needs
Editable research figures with reviewable labels and SVG exports
Scout Review
Written by AI from measured evidence, scored out of 100.
ExplainViz is a focused AI tool that turns research descriptions into publication-ready scientific figures, with editable SVG export and one-time credit pricing. The landing page is visually coherent and the speed is strong, but usability has rough edges and security lacks transparency. The product targets a real, underserved niche — researchers who need labeled diagrams without learning Illustrator — and its credit model avoids subscription fatigue. However, the moat is thin, and the early-stage domain suggests limited traction. For academics tired of redrawing frameworks, it's worth a try; for those needing institutional-grade security, it's not there yet.
Measure by measure
Usability
64Hero input and CTA are tightly grouped for fast signup-to-value. Three-step workflow is clear, but navigation lacks distinction between 'Create' and the primary CTA, and information density below the fold may slow scanning.
Design
71Coherent line-art illustration style and clear hero hierarchy make the homepage feel purpose-built for researchers. Minor issues: compressed lower sections and small text in feature cards.
Speed
73Lighthouse mobile 85/100 with LCP 3.5s and TBT 7ms; desktop 98/100. Solid performance overall, though mobile LCP is on the slower side for a content-heavy landing page.
Security
72HTTPS enforced with HSTS, frame protection, and most security headers present (9/12 checklist points). Missing CSP and DMARC, and no published SOC 2 or bug bounty. Solid baseline for an early-stage tool.
Accessibility
81Lighthouse accessibility 96/100 with one contrast failure. Multi-language support via 'Switch language' control. Strong automated score, though manual keyboard and screen-reader testing isn't evidenced.
Growth
58Real problem (researchers waste hours in Illustrator), specific audience (academics), and a concrete wedge: one-time credit packs instead of subscriptions. Differentiated but not defensible against generic AI image tools.
Improvement areas
- Design: lower sections feel compressed with small text and overlapping modal; improve scannability and spacing.
- Security: missing CSP and DMARC headers, no published SOC 2 or security page for institutional trust.
- Accessibility: contrast failure on process row; add keyboard navigation and screen-reader testing documentation.
Design & Usability
ExplainViz presents a polished, purpose-built landing page with a coherent line-art aesthetic that immediately signals 'research tool' rather than 'generic AI image generator'. The hero pairs a clear value proposition with an input field and CTA, making the core action obvious. Below the fold, the design gets cramped: feature cards use tiny text and thin dividers, and a 'What's new' modal overlaps content. Usability is competent — the three-step workflow is well explained, and the pricing page is refreshingly clear with one-time credit packs. However, navigation duplicates the 'Create' action in multiple places without visual hierarchy, and the density of information below the fold may slow down users trying to understand the full offering. Onboarding appears frictionless with a free start, but no live demo or interactive tutorial is evident from the site content.
Speed & Security
Speed is a strong point: Lighthouse desktop 98/100 and mobile 85/100, with a low CLS of 0.03 and TBT of just 7ms. The mobile LCP of 3.5s is the main drag, likely due to the large hero illustration and cream background assets. For a content-heavy landing page, this is above average. Security is solid but not exceptional: HTTPS is enforced with HSTS, and most security headers are present (9/12 checklist points). Missing CSP and DMARC are notable gaps for a product handling user research data, and there's no published SOC 2, ISO, or bug bounty program. For an early-stage tool, this is a reasonable baseline, but researchers uploading unpublished findings may want more assurance. The absence of a security page or data handling transparency is a missed opportunity to build trust with academic institutions.
Accessibility & Growth
Accessibility scores well on automated checks (Lighthouse 96/100) with only one contrast failure, and the site offers a language switcher. However, manual keyboard navigation and screen-reader support aren't evidenced, and the contrast issue affects readability for some users. Growth potential is moderate: ExplainViz targets a real pain point for researchers who spend hours in Illustrator, and its one-time credit model is a genuine differentiator against subscription-fatigued academics. The product names specific figure types (graphical abstracts, conceptual frameworks) and integrates with journal specs, which shows focus. But the moat is thin — generic AI image tools could add labeled diagram features, and the domain is only 0.2 years old with no visible community or traction signals. The idea can grow, but it needs to deepen its academic workflow integration to stay ahead.
Conclusion
ExplainViz gets the hard part right: it understands that researchers need accurate labels and editable vectors, not just pretty pictures. The one-time credit model respects academic budgets, and the speed is genuinely good. But the design needs polish below the fold, security needs a public trust page, and the product needs to prove it can handle complex, multi-panel figures without breaking. If you're a PhD student staring down a committee revision, this could save you a weekend. If you're a lab manager with unpublished data, wait for the security page. Either way, it's a promising start in a niche that's been ignored by big AI players.
Suggestions for improvement
- Add a live interactive demo or sample figure gallery so users can see output quality before signing up.
- Publish a security page with data handling details, and consider adding CSP and DMARC to close header gaps.
- Improve contrast on the three-step process row and increase text size in feature cards for better scannability.
- Add keyboard navigation and screen-reader testing documentation to back up the strong Lighthouse accessibility score.
Alternatives comparison
Named competitors, point by point. Nobody paid to appear here or to be left out.
 ExplainViz |  | |
|---|---|---|
| Pricing model | One-time credit packs from $5 (12 credits) to $200 (744 credits); no subscription. | No data available. |
| Export format | Editable SVG and high-resolution images (2K, 4K, CV-1). | No data available. |
| Target audience | Researchers, students, and academic teams for papers, theses, and posters. | No data available. |
| Free tier | Free starting access; no credit card required to start creating. | No data available. |
Comparing options? See ExplainViz alternatives, scored side by side
More Productivity apps
View all Productivity
StoryPad
92Privacy-first open source journal app with a continuous t...

Puzzly – B2B Lead Generation & Sales Intelligence Platform
92Puzzly is an all-in-one B2B lead generation platform that...

Vibe Coding Agent Skills
92A free, open-source platform offering 110 AI agent skills...

The Stack Newsletter
92A weekly newsletter delivering curated tech jobs, intervi...

Qamarero
92An all-in-one hospitality software for restaurants and ba...

Notion
92All-in-one AI workspace for docs, projects, and knowledge...

EmbedMyReviews
92White-label reputation management software for agencies s...

QRBliss
91Branded QR codes with AI Brand Sync, 15 free dynamic code...

Strukchad Property Management
91Property management for Kenyan letting agents: rent invoices raised every month, M-Pesa rent prompts to tenants, arrears tracking and landlord statements.

CC Switch
91Open-source desktop app for switching AI coding providers...

Gerty
91Private, local AI assistant for Mac that runs offline

BACKLNK
90Backlnk is a free SEO and AI visibility website: 15 website checks, a full audit as a PDF report, and guides to get found in search and AI answers.


A platform dedicated to providing unbiased reviews of newly launched applications, analyzing everything from their features to their full potential.
info@scoutforge.net© 2026 Scoutforge. All rights reserved.
