

A platform dedicated to providing unbiased reviews of newly launched applications, analyzing everything from their features to their full potential.
info@scoutforge.net© 2026 Scoutforge. All rights reserved.
A platform dedicated to providing unbiased reviews of newly launched applications, analyzing everything from their features to their full potential.
info@scoutforge.net© 2026 Scoutforge. All rights reserved.
A platform dedicated to providing unbiased reviews of newly launched applications, analyzing everything from their features to their full potential.
info@scoutforge.net© 2026 Scoutforge. All rights reserved.
Cycling through all six. Tap any point to stop.
Measured on six things
AI that grades your trading chart before you enter
Lighthouse desktop 99/100 but mobile 69/100 with a 4.8s LCP and 283ms TBT. Fine on a laptop, sluggish on the phone traders actually check charts on.
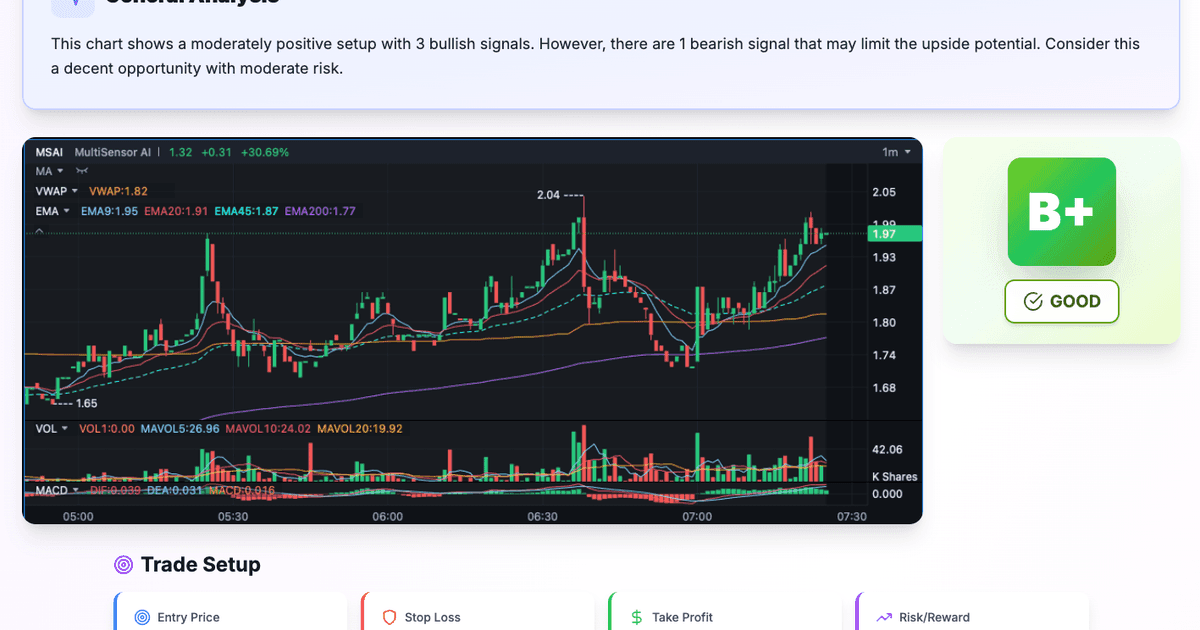
SnapPChart turns a chart screenshot into a structured, repeatable trade review. Instead of a vague description, you get the same fields on every upload: a letter grade from A+ to F, the pattern, key levels, an entry zone, a stop with rationale, two profit targets with risk/reward, and an explicit bear case. It reads stocks, forex, crypto, futures, and ETFs from any platform because it works off the image, not a data feed. The point is consistency: grade every setup against identical criteria so an A setup and a C setup are scored the same way and your own bias does not move the grade. New users get two free grades, no card required. Paid plans grade every chart and keep the history.
Drawn from the product itself, not from a survey.
Demographic
Active day traders (stocks, forex, crypto)
Pain points
Overtrading, impulsive entries, lack of objective feedback
Primary needs
Quick validation of trade setups before risking capital
Demographic
Swing traders and position traders
Pain points
Difficulty identifying high-probability setups, emotional bias
Primary needs
Structured analysis with clear entry, stop, and targets
Demographic
Prop firm challenge participants
Pain points
Strict risk management rules, need to avoid overtrading
Primary needs
Disciplined trade grading and risk assessment
Demographic
Beginner traders learning technical analysis
Pain points
Lack of experience in reading charts and managing risk
Primary needs
Educational feedback and a second opinion on setups
Written by AI from measured evidence, scored out of 100.
SnapPChart is a focused, well-presented tool that does one thing: turn a chart screenshot into a graded trade plan with entry, stop, targets, R/R, and a written thesis. The design is the standout — the sample output card is the best sales asset on the site. Usability is clean, onboarding is fast, and the pricing ladder ($4.99/week, $19.99/month, $199.99/year) is sensibly tiered for a trader testing the waters. Security is solid for its stage. The weaknesses are mobile performance (4.8s LCP), a pinch-zoom-blocking viewport, and a two-grade free tier that's too thin to build trust. The idea is genuinely differentiated against TradingView and StocksToTrade, but the moat is a prompt, not a platform.
Drag-and-drop upload, no symbol entry, two free grades without a card, and a pricing FAQ that actually answers questions. Onboarding-to-value is short and the optional Trader Profile avoids forcing setup.
Dark, modern trading-dashboard aesthetic with a consistent card system across homepage and pricing. The sample NVDA grade card is the strongest asset — it shows the product instead of describing it.
Lighthouse desktop 99/100 but mobile 69/100 with a 4.8s LCP and 283ms TBT. Fine on a laptop, sluggish on the phone traders actually check charts on.
HTTPS enforced with HSTS, frame protection, and most hardening headers present (10/12). Stripe handles payments. No CSP header and no published SOC 2, pen-test, or bug bounty.
Lighthouse accessibility 95/100, but the viewport disables pinch-zoom (user-scalable=no) and some visible text labels lack matching accessible names. No WCAG statement published.
Real problem (inconsistent, biased self-grading), specific segment (day/swing traders, prop-firm challengers), and a genuine wedge: screenshot-based grading that TradingView and StocksToTrade don't offer.
SnapPChart's design is the strongest part of the package. The dark dashboard aesthetic is consistent from homepage to pricing, and the sample NVDA 1H card — A− grade, entry $142.30, stop $138.50, target $148.20, R/R 2.6:1, plus a written thesis — does more selling than any headline could. Usability follows through: drag-and-drop upload, no symbol to type, PNG/JPG/WebP up to 10MB, and two free grades with no card. The Trader Profile is optional and the site says so plainly. The pricing FAQ answers the questions people actually ask (what's in the free tier, weekly vs monthly, cancellation, supported markets). Where it slips: the free tier is two lifetime grades, which is enough to feel the product and not enough to trust it, and there's no visible documentation or help center beyond the FAQ.
Speed is a split verdict. Desktop Lighthouse performance is 99/100 — genuinely fast. Mobile is 69/100 with a 4.8s LCP, 2.7s FCP, and 283ms TBT, which is the number that matters for a tool aimed at people who screenshot charts on their phone. Security is quietly competent: HTTPS enforced, HSTS, frame protection, X-Content-Type-Options, Referrer-Policy, and Permissions-Policy all present, 10 of 12 checklist points, with Stripe handling payments so card data never touches the app. The gaps are the usual early-stage ones — no CSP header, and no published SOC 2, ISO, pen-test, or bug bounty. For a product that ingests screenshots of live positions, a security page would be a reasonable next step, but nothing here is broken.
Accessibility scores 95/100 on Lighthouse, which is high, but two real failures sit underneath: the viewport sets user-scalable=no, blocking pinch-zoom, and some visible text labels don't have matching accessible names. Both are cheap to fix and both matter for a mobile-heavy audience. There's no WCAG statement or a11y page. Growth is the more interesting question. The problem is real — traders grade their own setups with their own bias and call it analysis — and the wedge is specific: screenshot-based grading that works on any platform, with identical criteria every time. TradingView is a charting and social platform; StocksToTrade is scanners and alerts. Neither grades a screenshot against a fixed rubric. The target segment (day traders, prop-firm challenge participants, beginners wanting structured feedback) is narrow but pays. The limit is that the moat is thin: the grading is an AI prompt, and the incumbents could bolt it on. Domain registered October 2025, one social profile listed — early, but the idea has room.
Conclusion
If you're a day trader who already screenshots charts and argues with yourself about whether the setup is good, SnapPChart is worth two free grades to see if the AI's read matches yours. If it does, you've learned nothing. If it doesn't, that's the product working. The $4.99 weekly plan is the honest way to test it — run a real week, grade 15 setups, and see whether the grades change any decision you make. If they don't, cancel and you've lost less than a bad scalp. If they do, the $199.99 yearly is cheap relative to one avoided red day. The caveats are real: mobile is slow, the free tier is thin, and the grading quality is the entire product — so test it on setups you already know the answer to before you trust it on ones you don't.
Named competitors, point by point. Nobody paid to appear here or to be left out.
 SnapPChart SnapPChart |  TradingView TradingView |  StocksToTrade StocksToTrade | |
|---|---|---|---|
| AI setup grading from a chart screenshot | Core feature — A+ to F grade with entry, stop, targets, R/R, and written thesis | Not offered — charting and social analysis only | Not offered — scanners, alerts, and trade ideas |
| Works from any platform via screenshot (no data feed) | Yes — TradingView, Webull, ThinkOrSwim, Robinhood, IBKR, MetaTrader | Native charts only — analysis happens inside TradingView | Platform-bound — data and scanners live inside StocksToTrade |
| Consistent grading rubric across every setup | Yes — identical criteria per upload, explicitly anti-bias | No — analysis is user-driven and community opinion varies | No — alerts and scanners, no standardized setup grade |
| Free tier without a credit card | 2 lifetime grades, no card required | Free plan with limited indicators and one chart per layout | Trial-based; full access requires paid subscription |
| Pricing entry point | $4.99/week, $19.99/month, $199.99/year (unlimited grades) | Free tier; paid plans scale well above $19.99/month | Monthly subscription, typically higher than $19.99 |
TradingView
A popular charting platform with social features, but lacks AI-driven setup grading.
StocksToTrade
A trading platform with scanners and alerts, but no instant AI chart analysis from screenshots.
Comparing options? See SnapPChart alternatives, scored side by side

A free, comprehensive financial calculator platform with ...

A no-code Solana token creator that deploys SPL tokens in...

AI invoice follow-up that drafts reminders and tracks next steps.

Automated bookkeeping software that extracts data from re...

A top-rated virtual assistant agency that matches busines...

Connect your bank to AI for real answers about your money.

A developer-first financial data API providing structured...

Stripdo is a smart invoicing tool that automatically gene...

Real-time monetization infrastructure for AI products tha...

Screen stocks using 30+ value disciplines. Receive an email when your investment thesis breaks.

Business workspace for solo founders and small teams.

Professional quoting with reusable pricing rules, polished proposals and online customer approvals.
A platform dedicated to providing unbiased reviews of newly launched applications, analyzing everything from their features to their full potential.
info@scoutforge.net© 2026 Scoutforge. All rights reserved.