Cycling through all six. Tap any point to stop.
Measured on six things
See what denials and slow AR cost your home care agency
Growth
58A real, specific problem for a named niche (1–50 clinician home health agencies), with a genuine wedge: personalized dollar figures and a fix-comparison no benchmark PDF or Excel tracker gives you.
Screenshots
1 / 1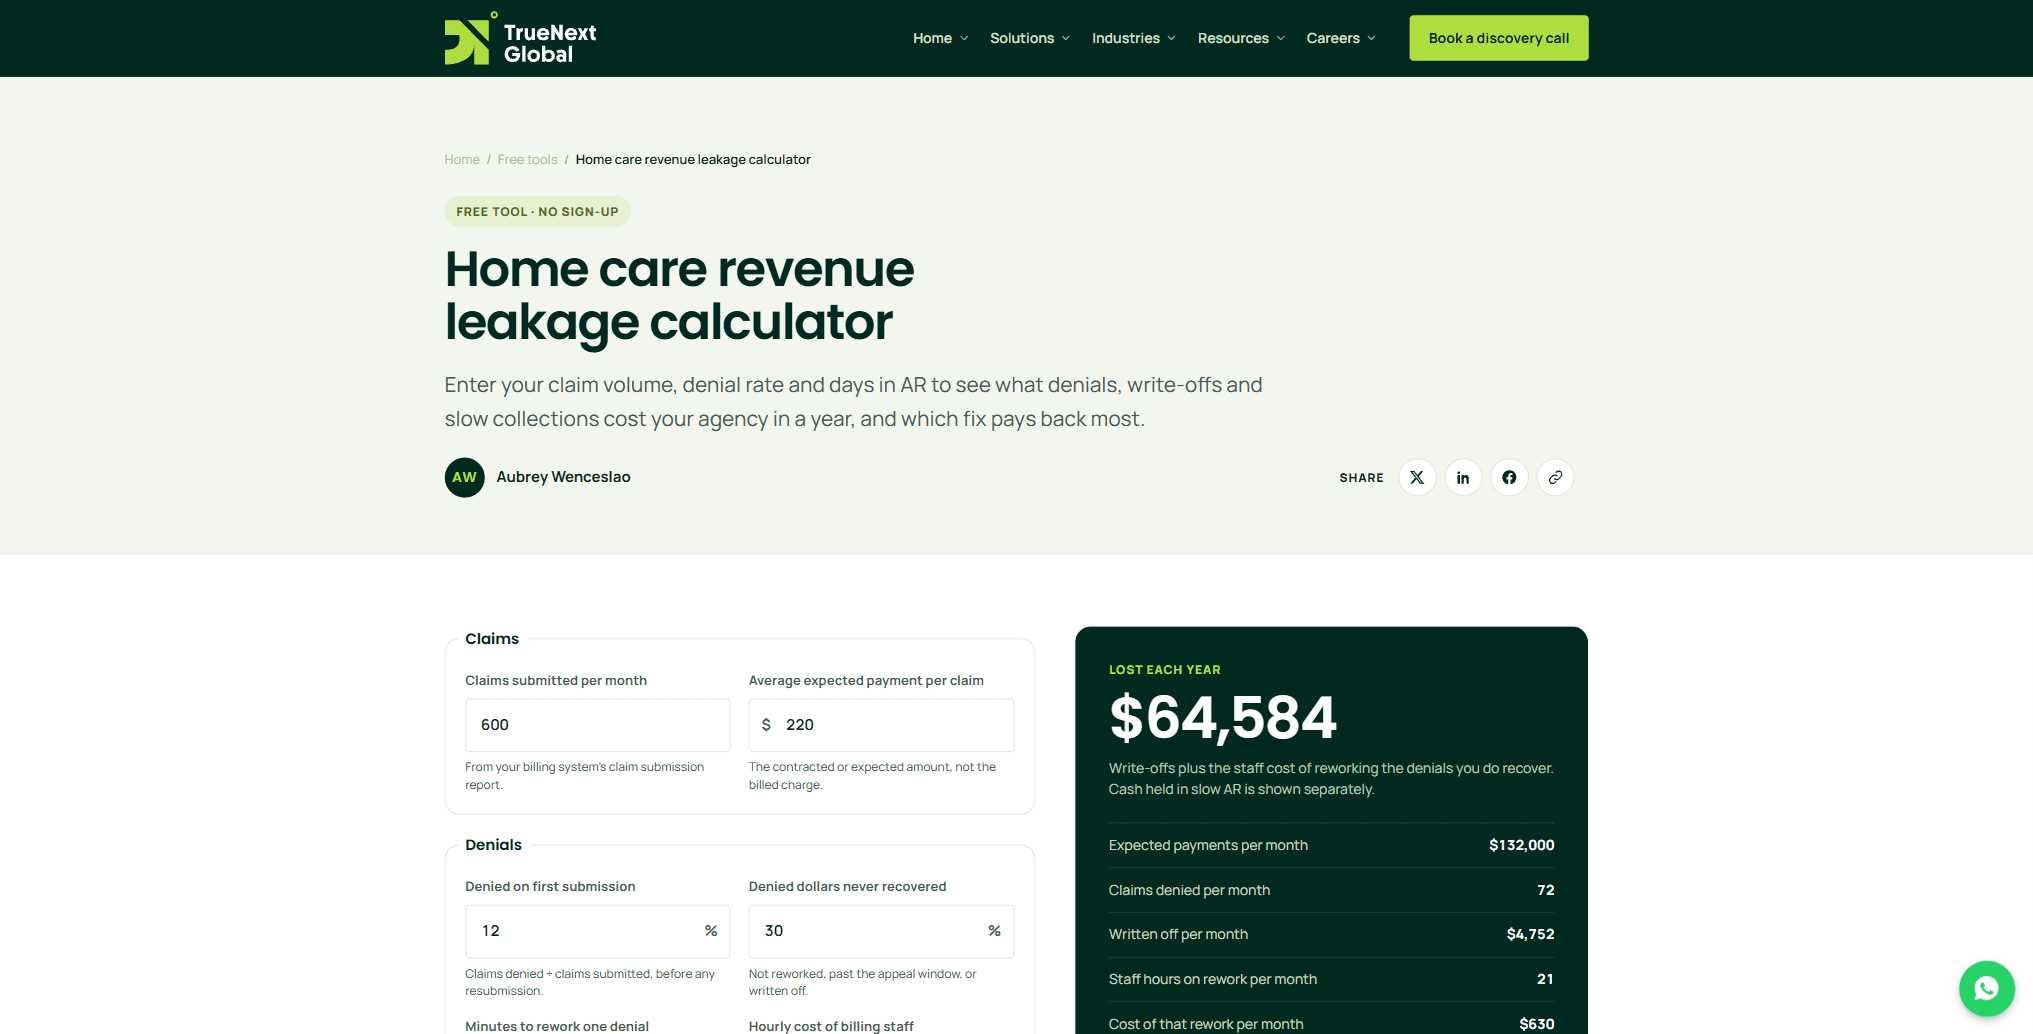
About this app
Free calculator for home care and home health agencies. Enter claim volume, denial rate, write-off share, rework time and days in AR, and it shows what denials, write-offs and slow collections cost each year, plus which fix (fewer denials or recovering write-offs) pays back more. Shows every formula. Runs in the browser; nothing entered is sent or stored. No sign-up. Built by TrueNext Global Services Inc. (Manila, Philippines).
Key features
- 1Eight-input calculator converting claim volume, denial rate, write-off share, rework time and days in AR into an annual leakage figure.
- 2Side-by-side comparison of savings from cutting denials 25% versus recovering half of write-offs.
- 3Every formula shown in plain English; results update live with a shareable result link and no sign-up.
Target customer profile
Drawn from the product itself, not from a survey.
Demographic
Home health agency owners and executive directors (Medicare-certified, 1–50 clinicians)
Pain points
Denied claims pile up unworked, write-offs go unreviewed, and leaders can't quantify the cost of inaction
Primary needs
A quick dollar estimate of revenue lost to denials, write-offs and slow AR
Demographic
Home care and Medicaid personal care agency billing managers
Pain points
Eligibility lapses, expired authorizations, and EVV mismatches cause first-pass denials they can't easily prioritize
Primary needs
A clear comparison of which fix (fewer denials or recovering write-offs) pays back more
Demographic
Revenue cycle and operations consultants serving home health agencies
Pain points
Need a quick, neutral diagnostic to open client conversations without building a custom spreadsheet
Primary needs
A transparent calculator that shows every formula and can be shared by link
Scout Review
Written by AI from measured evidence, scored out of 100.
A genuinely well-executed free diagnostic. It takes eight inputs a billing manager already knows, shows every formula, and returns an annual leakage figure plus a direct comparison of which fix — fewer denials or recovering write-offs — pays back more. The engineering is clean: 100/100 Lighthouse performance, 97/100 accessibility, ten of twelve security headers, no sign-up, and a shareable result link that makes it easy to open a client conversation. The weaknesses are commercial rather than technical: a discovery-call CTA repeated about five times, overlapping footer widgets, and small low-contrast explainer text. As a lead magnet it is sharper than most; as a standalone product it is a single page with no account, history or benchmarking layer.
Measure by measure
Usability
74No sign-up, live-updating results, shareable result links and every formula shown with plain-English glosses. Inputs carry helper text explaining where each number comes from. Dense explainer sections slow scanning.
Design
70Disciplined forest-green/lime palette, grouped input cards and a receipt-style results panel with one dominant figure. Overlapping cookie/WhatsApp widgets and small grey explainer text cost it polish.
Speed
88Lighthouse 100/100 on both mobile and desktop: LCP 920ms, CLS 0, TBT 0ms. A lightweight single-tool page that loads essentially instantly with no layout shift.
Security
72HTTPS enforced with HSTS, frame protection, X-Content-Type-Options, Referrer-Policy, Permissions-Policy, SPF and DMARC (10/12). No CSP header and no published compliance page, but inputs are client-side only.
Accessibility
80Lighthouse accessibility 97/100 with one failing audit: insufficient color contrast. Labelled inputs, responsive layout and clear structure are strong; no a11y statement or multi-language support found.
Growth
58A real, specific problem for a named niche (1–50 clinician home health agencies), with a genuine wedge: personalized dollar figures and a fix-comparison no benchmark PDF or Excel tracker gives you.
Improvement areas
- Missing Content-Security-Policy header and no published security/compliance page.
- Failing color-contrast audit and small, light-grey long-form explainer text.
- Discovery-call CTA repeated ~5 times; cookie banner and WhatsApp bubble overlap the footer.
Design & Usability
The page is well-built for what it is: a single-purpose calculator with a disciplined green-and-lime palette, grouped input cards (Claims, Denials, Collections) with unit affixes and helper text, and a results panel that leads with one oversized figure and a receipt-style ledger. Usability is the stronger half — no sign-up, results that update live, a shareable result link, a 'back to the example' reset, and every formula printed with a plain-English gloss. The friction is commercial, not functional: 'Book a discovery call' appears roughly five times, and the cookie banner plus WhatsApp bubble overlap the footer. Long explainer sections in small light-grey type slow scanning after the tool itself is done.
Speed & Security
Speed is the standout: Lighthouse reports 100/100 on both mobile and desktop, with LCP at 920ms, CLS at 0 and TBT at 0ms. There is no heavy SPA, no shift, no wait — the tool is usable almost immediately. Security is solid for the category: HTTPS enforced with HSTS, frame protection, X-Content-Type-Options, Referrer-Policy and Permissions-Policy all present, plus SPF and DMARC, for 10 of 12 checklist points. The gap is a missing Content-Security-Policy header and no published compliance or security page. The privacy model is genuinely simple — inputs are computed in the browser and the page states nothing is sent or stored — which lowers the stakes considerably for a tool that handles no PHI.
Accessibility & Growth
Accessibility scores 97/100 in Lighthouse, with a single failing audit for insufficient color contrast — consistent with the visual audit's note that long-form explainer text is set small and light grey. Inputs are properly labelled, the layout is responsive, and structure is clear; there is no published accessibility statement or multi-language support. Growth is a judgement on the idea: the problem is real and specific (denials, write-offs and slow AR at Medicare-certified home health agencies with 1–50 clinicians), the target customer is named precisely, and the wedge over the listed alternatives is concrete — HFMA publishes benchmarks but won't turn your inputs into your annual leakage figure, and an Excel tracker is manual and breaks. The honest limit is that this is a top-of-funnel diagnostic for a billing/consulting firm; its value compounds through the pipeline it feeds, not through the tool itself.
Conclusion
If you run or advise a small home health or Medicaid personal care agency and you cannot put a dollar figure on your denials and write-offs, this is thirty seconds well spent — the math is transparent and the two 'saved a year' comparisons are the part most spreadsheets never bother to compute. Treat it as a diagnostic, not a system: it will tell you the size of the leak and roughly which lever is worth pulling, but working the denials still happens in your billing software. The privacy posture is honest and the speed is excellent. Fix the contrast and thin out the sales CTAs and this becomes an easy link to send to any agency owner.
Suggestions for improvement
- Add a Content-Security-Policy header to complete the security header set.
- Fix the failing color-contrast audit and raise the size/weight of long-form explainer text.
- Reduce the discovery-call CTA from roughly five placements to one or two, and stop the cookie/WhatsApp widgets overlapping the footer.
- Publish a short accessibility statement and consider a Spanish version for Medicaid personal care agencies.
Alternatives comparison
Named competitors, point by point. Nobody paid to appear here or to be left out.
 Home Care Revenue Leakage Calculator | HFMA MAP Keys and Revenue Cycle Benchmarks |  Custom Excel denial tracker | |
|---|---|---|---|
| Turns your agency's own inputs into a personalized annual leakage dollar figure | Yes — eight inputs produce a live annual figure ($64,584 in the example) | No — publishes industry benchmarks, not personalized figures | Only if you build the formulas yourself |
| Compares which fix pays back more (fewer denials vs. recovering write-offs) | Yes — shows both 'saved a year' scenarios side by side | No — benchmark reference only | No — manual setup required |
| Home care-specific inputs (EVV, NOA timing, authorization lapses) | Yes — explainer covers EVV mismatches, late NOA, eligibility and authorization lapses | General healthcare revenue cycle, not home care-specific | No — generic spreadsheet |
| No sign-up, runs in browser, nothing stored | Yes — free, no account, client-side only | Some resources require HFMA membership | Requires Excel license and local file management |
| Transparent formulas you can audit | Yes — every formula listed with plain-English gloss | Benchmark methodology published, not a calculator | Depends entirely on how the workbook was built |
HFMA MAP Keys and Revenue Cycle Benchmarks
Industry benchmark resources for denial rates and days in AR, but they don't convert your agency's inputs into a personalized annual leakage figure.
Custom Excel denial tracker
The traditional DIY approach many billing teams use; flexible but manual, easy to break, and not built around home care-specific inputs like EVV and NOA timing.
Comparing options? See Home Care Revenue Leakage Calculator alternatives, scored side by side
More Financial Management apps
View all Financial Management
CalcFi
92A free, comprehensive financial calculator platform with ...

Strukchad Property Management
91Property management for Kenyan letting agents: rent invoices raised every month, M-Pesa rent prompts to tenants, arrears tracking and landlord statements.

Redstone
89Portfolio optimization and risk metrics for investors.

Critivest
88Stock analysis based on your own criteria

Prop Firm Consistency Calculator
88Check your prop firm consistency rule and best-day percen...

ArbPlay
88Real-time sure bets scanner for Greek bookmakers, exchang...

SiftingIO - Market Data API
88Real-time & historical market data API for stocks, forex,...

DataHabibi
88AI-powered Dubai real estate data platform with 12M+ DLD ...

HISAB 360
87A Windows Excel add-in that pulls your ledger data into the workbook, reconciles it, and drafts the reports - all in plain English, inside Excel.

StatementTrust
87Convert PDF bank statements to clean Excel/CSV — in-brows...

ZeraBooks
87AI bookkeeping software that runs your books completely automated, for businesses and for bookkeepers with many clients. Free setup and catch-up. From $79/mo.

Nautis
87Nautis is an AI-native operating system that helps founders manage finance, fundraising, sales, teams, and operations with an AI Chief of Staff.


A platform dedicated to providing unbiased reviews of newly launched applications, analyzing everything from their features to their full potential.
info@scoutforge.net© 2026 Scoutforge. All rights reserved.
