A platform dedicated to providing unbiased reviews of newly launched applications, analyzing everything from their features to their full potential.
info@scoutforge.netProduct
© 2025 Scoutforge. All rights reserved.
A platform dedicated to providing unbiased reviews of newly launched applications, analyzing everything from their features to their full potential.
info@scoutforge.net© 2025 Scoutforge. All rights reserved.
A platform dedicated to providing unbiased reviews of newly launched applications, analyzing everything from their features to their full potential.
info@scoutforge.net© 2025 Scoutforge. All rights reserved.
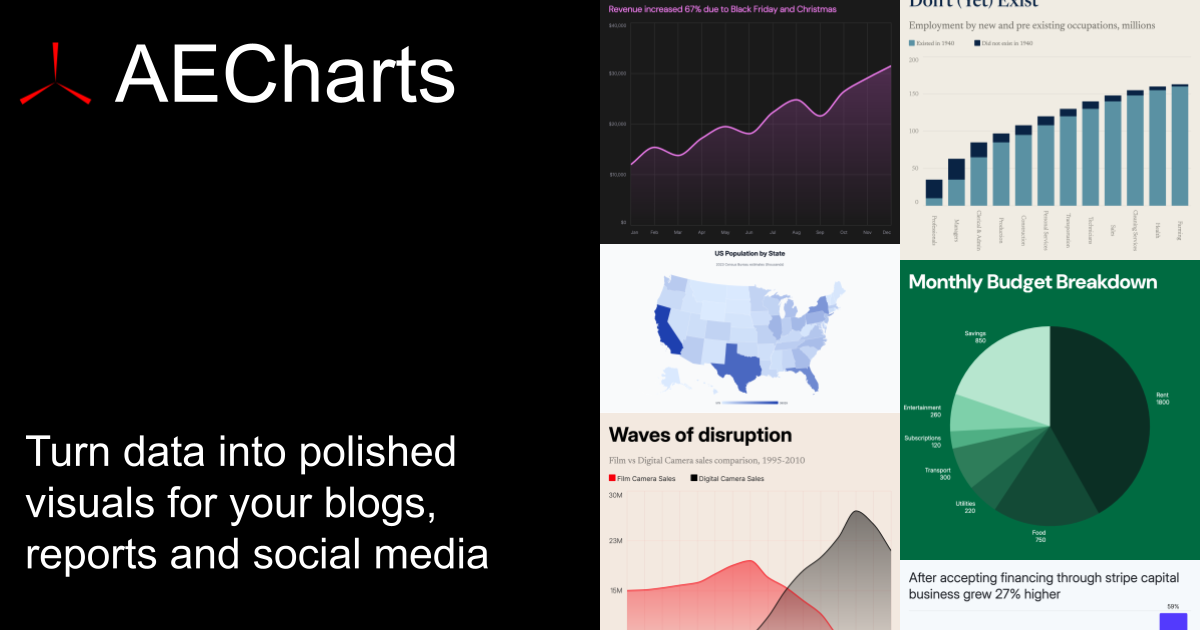
As a tech-savvy reviewer, I've been exploring tools that make data visualization not just informative but downright captivating. AECHARTS caught my eye because it solves a common pain point: turning dry numbers into animated, professional charts without needing design skills or complex software. This web-based tool lets you create animated charts in seconds, with 14 chart types like bar, line, pie, scatter, and even trendy bar races. You simply pick a template, paste data from Excel or CSV, customize colors and fonts, and export as MP4, PNG, or JPEG. What stands out is its brand kit feature, which automatically applies your company's branding to every chart—a huge time-saver for teams. It's designed for professionals who need to make data pop in pitch decks, client reports, or social media posts, and with a free plan available, it's accessible for startups and solo entrepreneurs too. From my experience, the instant preview and flexible export options make it a go-to for anyone tired...
Scout Review
0Feedbacks

A data visualization platform with interactive and animated charts, often used for storytelling and reports.

A tool for creating simple, embeddable charts and maps, popular in news and academic settings.

A graphic design platform with chart templates, but less focused on animation and data-specific features.
AECHARTS delivers on its core promise: turning spreadsheet data into polished, animated chart videos faster than anything else in its class. The combination of easy data import, brand consistency, instant previews, and direct MP4 export makes it uniquely valuable for non-designers who need professional-looking data visuals for presentations, reports, or social media. It's not trying to be a full data storytelling platform like Flourish or a general design tool like Canva—it's laser-focused and executes that focus very well.
| Features | ||||
|---|---|---|---|---|
| Direct MP4 video export of animated charts | Native 1080p MP4 in ~5s, data-driven animation | Enterprise-only video (~$5000/yr), otherwise screen record | No video/animation export, static charts only | MP4 export available but not data-driven chart animation |
| Brand consistency / Brand kit | Dedicated brand kit with auto-apply fonts, colors, logo | Basic theming, no dedicated brand kit | Style templates but limited automatic branding | Brand kit available in Pro, works across designs |
| Primary use case & output | Animated video charts for presentations & social media | Interactive stories, scrollytelling, journalism embeds | Clean static charts & maps for news/academia | General graphic design with occasional charts |
| Pricing for video/animation features | Free images, $190/yr for video | Free tier limited, video enterprise ~$5000+/yr | No video, paid from ~$599/mo for advanced | Free tier, Pro ~$15/mo with animations |
A platform dedicated to providing unbiased reviews of newly launched applications, analyzing everything from their features to their full potential.
info@scoutforge.net© 2025 Scoutforge. All rights reserved.
